티스토리 뷰
반응형
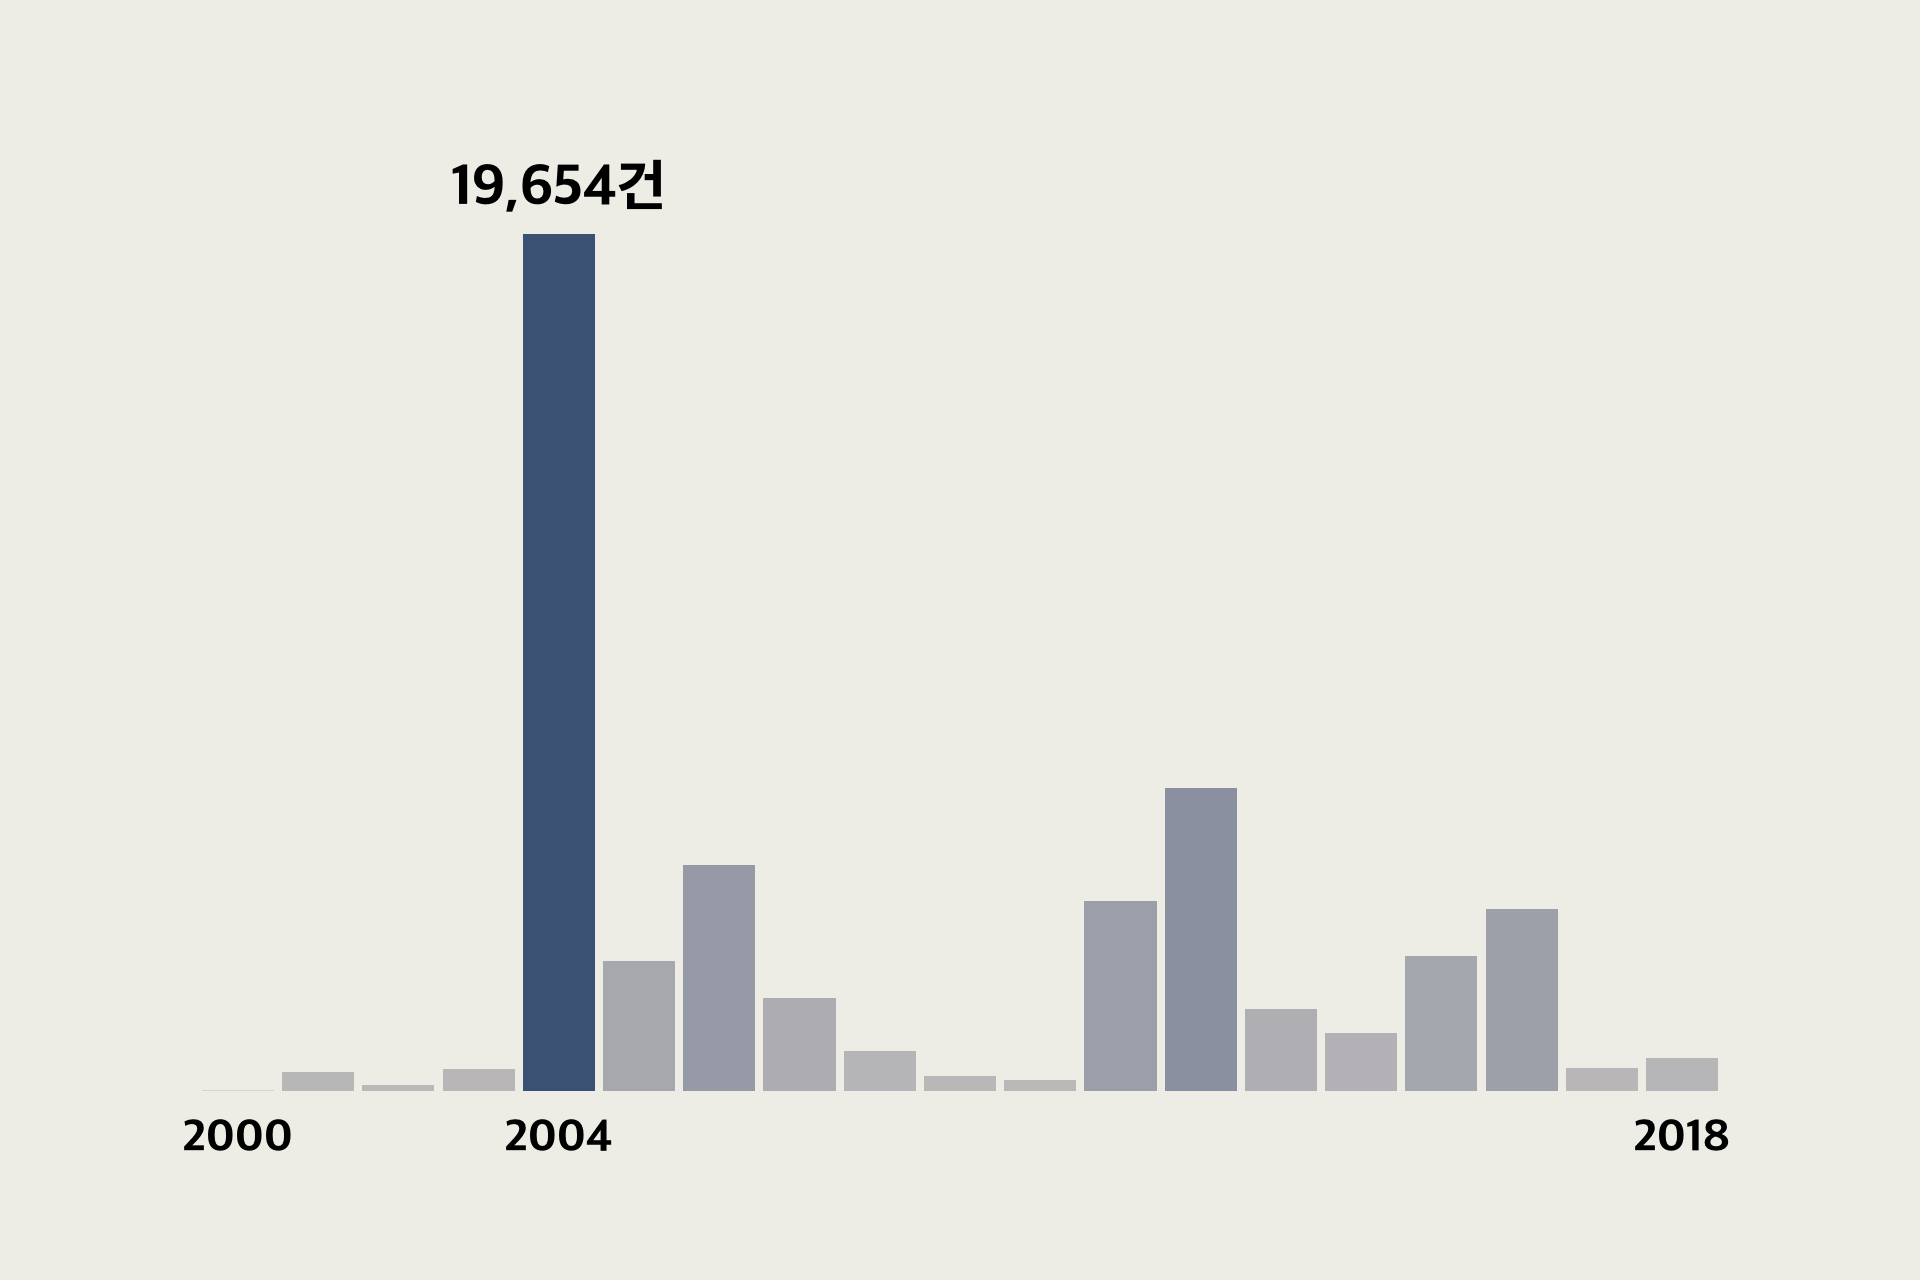
아래와 같이 막대그래프를 만들어보고자 한다. 컨셉은, 가장 높은 막대에만 가장 진한색상으로 강조하고, 년도와 건수로 더 강조해본다.
#tidytuesday 에서 데이터를 하나 가져와서 샘플로 사용한다. 샌프란시스코를 기준으로 년도별 건수만 집계해놓는다.
rent <- readr::read_csv('https://raw.githubusercontent.com/rfordatascience/tidytuesday/master/data/2022/2022-07-05/rent.csv')


rent_sanfrancisco = rent %>%
  filter(city == 'san francisco') %>%
  group_by(year) %>%
  summarise(count = n()) %>%
  arrange(year)
우선 세줄 정도의 코딩으로 간단한 막대그래프를 만들수 있다. 하지만 디자인이 아쉽다.
ggplot(rent_sanfrancisco, aes(year, count, fill = count)) +
  geom_col() +
  theme(legend.position = "none")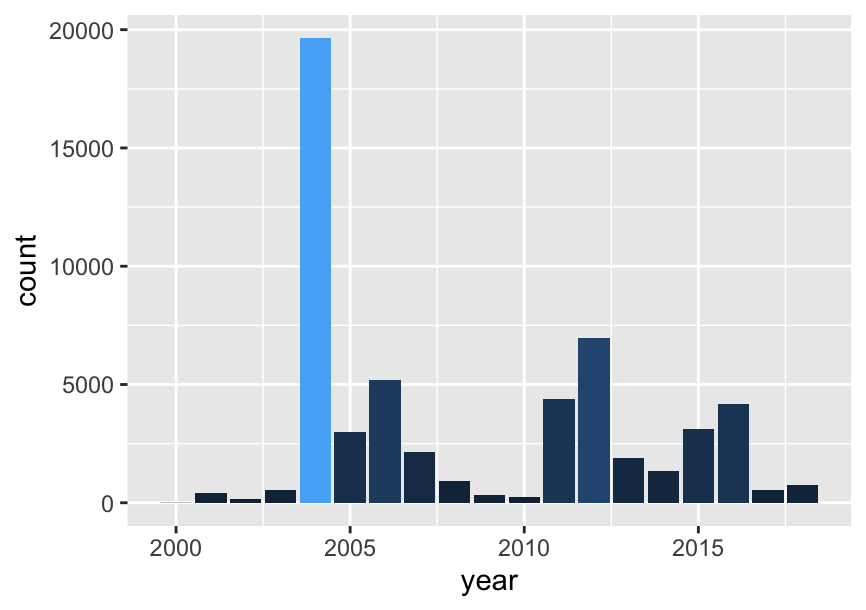
반응형
x 축 텍스트를 지정하고, y 축 가장 긴 막대그래프 위에 숫자를 넣어준다.
ggplot(rent_sanfrancisco, aes(year, count, fill = count)) +
  geom_col() +
  annotate(geom = "text", x = 2004, y = 19654, label =19654,
           size = 4.5, vjust = -.7) +
  scale_x_continuous(breaks = c(2000, 2004, 2018)) +
  scale_y_continuous(limits = c(0, max(rent_sanfrancisco$count) * 1.1)) +
  theme(legend.position = "none")
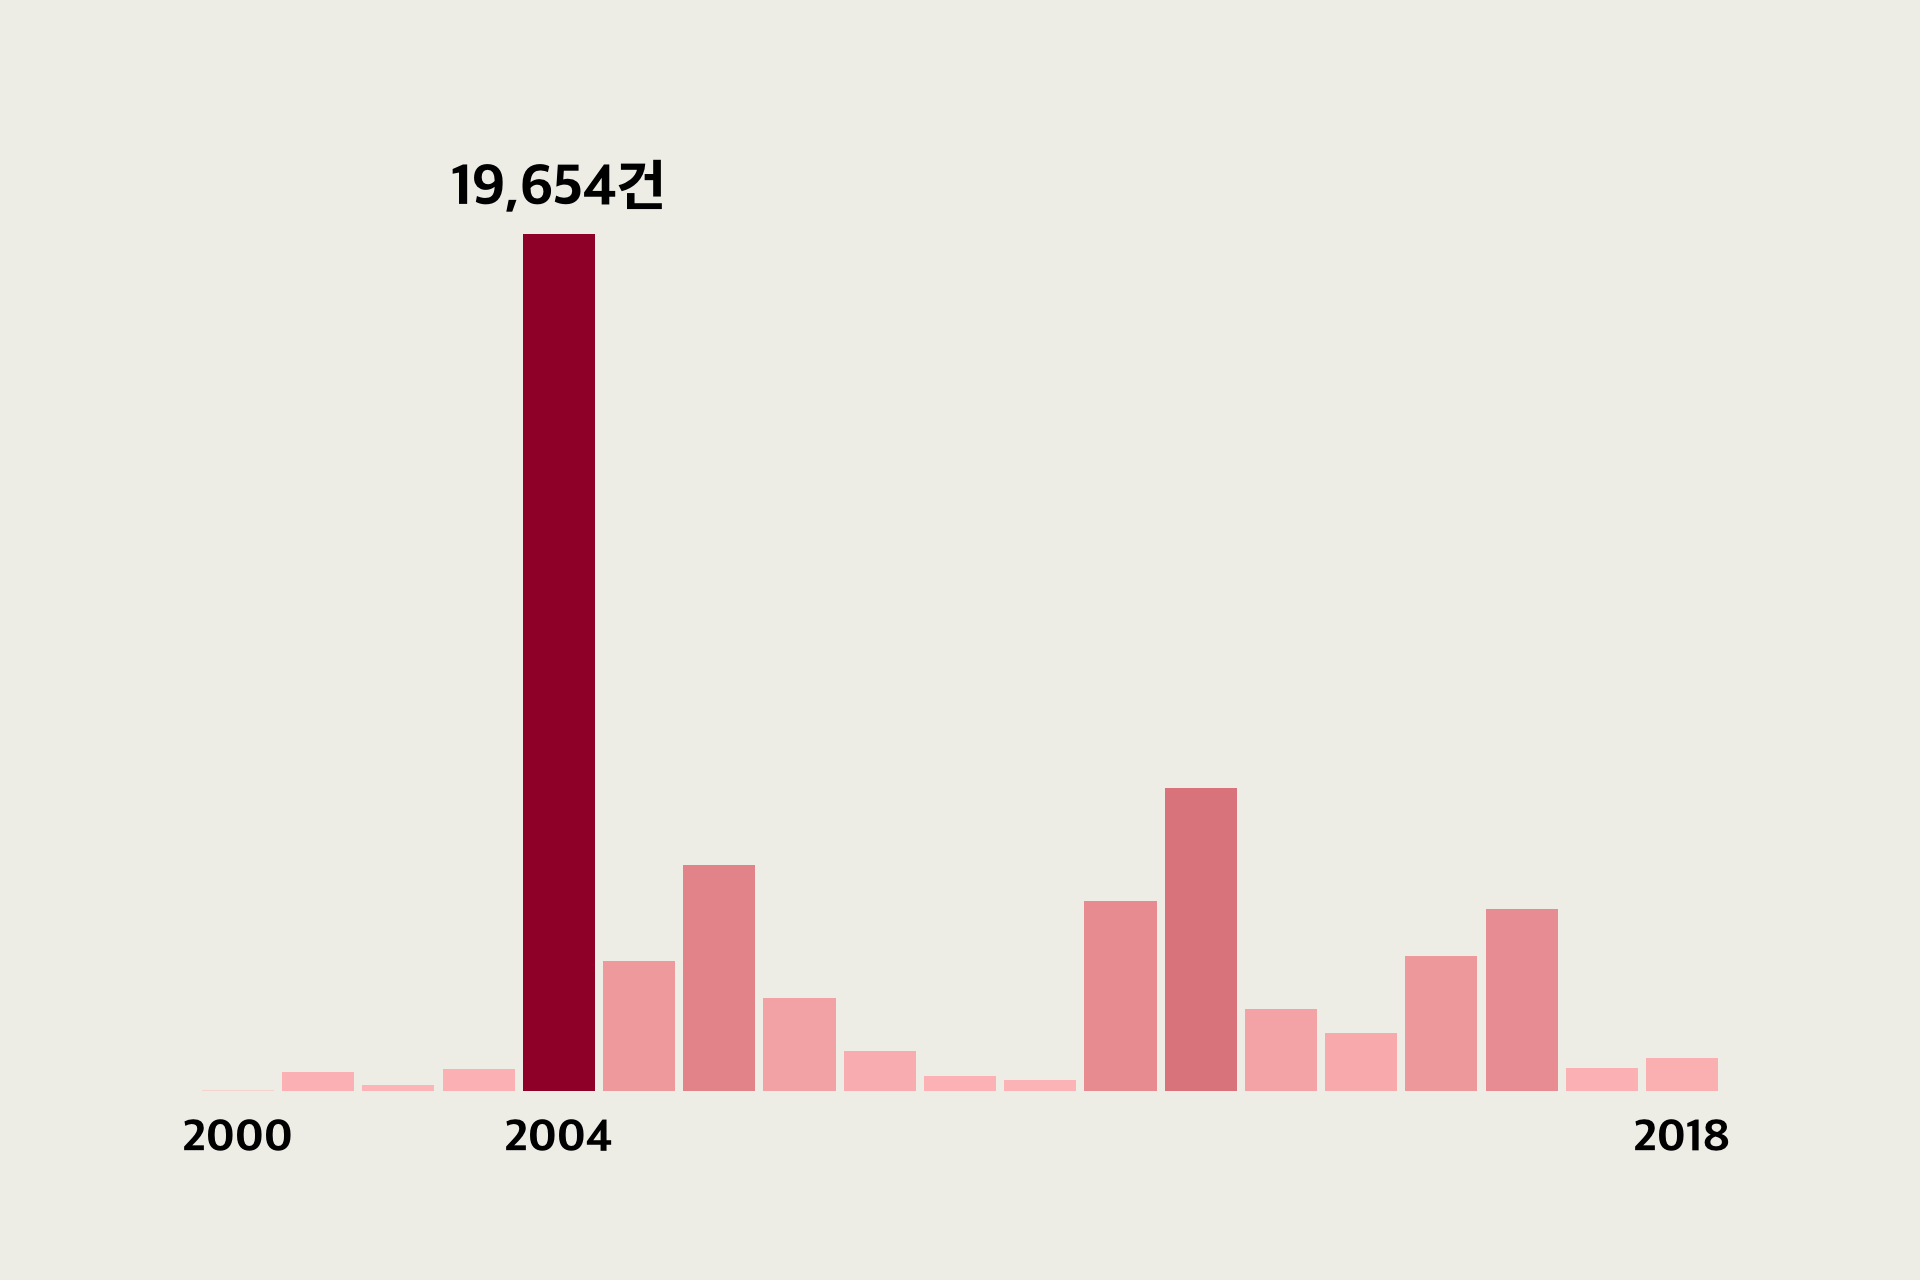
이제 디자인만 하면된다. 쓸데없는 x/y 축 정보를 지우고, 색상을 취향에 맞춰서 지정하면 완성이다.
ggplot(rent_sanfrancisco, aes(year, count, fill = count)) +
  geom_col() +
  scale_x_continuous(breaks = c(2000, 2004, 2018)) +
  scale_y_continuous(limits = c(0, max(rent_sanfrancisco$count) * 1.2),
                     expand = expansion(c(0.00,0))) +
  scale_fill_gradient(low = "#FFC4C4", high = "#A10035" ) +
  theme_void(base_family = "AppleSDGothicNeo-ExtraBold", base_size = 13) +
  annotate(geom = "text", x = 2004, y = 19654, label = "19,654건",
           size = 4.5, vjust = -.7,
           family = "AppleSDGothicNeo-ExtraBold") +
  theme(
    legend.position = "none",
    axis.text.x = element_text(margin = margin(0.2,0,0,0,"cm"), size = 10),
    plot.margin = margin(0.5,1,1,1,"cm")
  )
반응형
공지사항
최근에 올라온 글
최근에 달린 댓글
- Total
- Today
- Yesterday
링크
TAG
- docker
- 셀프개통
- 막대그래프
- 도넛차트
- java
- eclipse
- MongoDB
- vagrant
- 알뜰요금제
- 아이맥
- Oracle
- MySQL
- SVN
- ggplot2
- python
- ubuntu
- ipTIME
- javascript
- ktm모바일
- 마인크래프트
- heroku
- R
- 자급제폰
- Google Chart Tools
- 이클립스
- ggplot
- 맥북
- MyBatis
- Spring
- github
| 일 | 월 | 화 | 수 | 목 | 금 | 토 |
|---|---|---|---|---|---|---|
| 1 | 2 | 3 | 4 | 5 | 6 | 7 |
| 8 | 9 | 10 | 11 | 12 | 13 | 14 |
| 15 | 16 | 17 | 18 | 19 | 20 | 21 |
| 22 | 23 | 24 | 25 | 26 | 27 | 28 |
| 29 | 30 | 31 |
글 보관함