티스토리 뷰
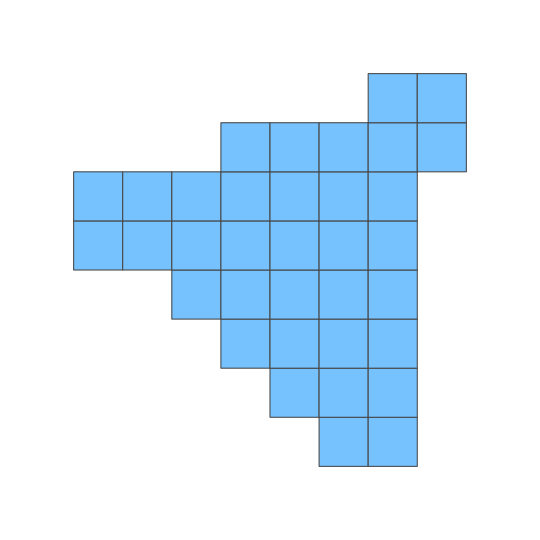
각각의 ggplot 그래프를 이어 붙이는 역할을 해주는 라이브러리가 있는데 patchwork 라고 있다. + / - 등의 사칙연산으로 간단히 붙일 수 있고, 필요하면 레이아웃을 비율대로 조정도 가능하다. ggplot2 로 그래프를 각각 잘 만들게 되었다면, 그 각각의 그래프를 가지고 아래와 같이 대시보드 형태를 만들수 있게 되는 것이다. 애니메이션 효과 등이 부족하지만, 그냥 ppt, word, 한글 문서등에 붙이는 용도로는 이만한게 없지 싶다.

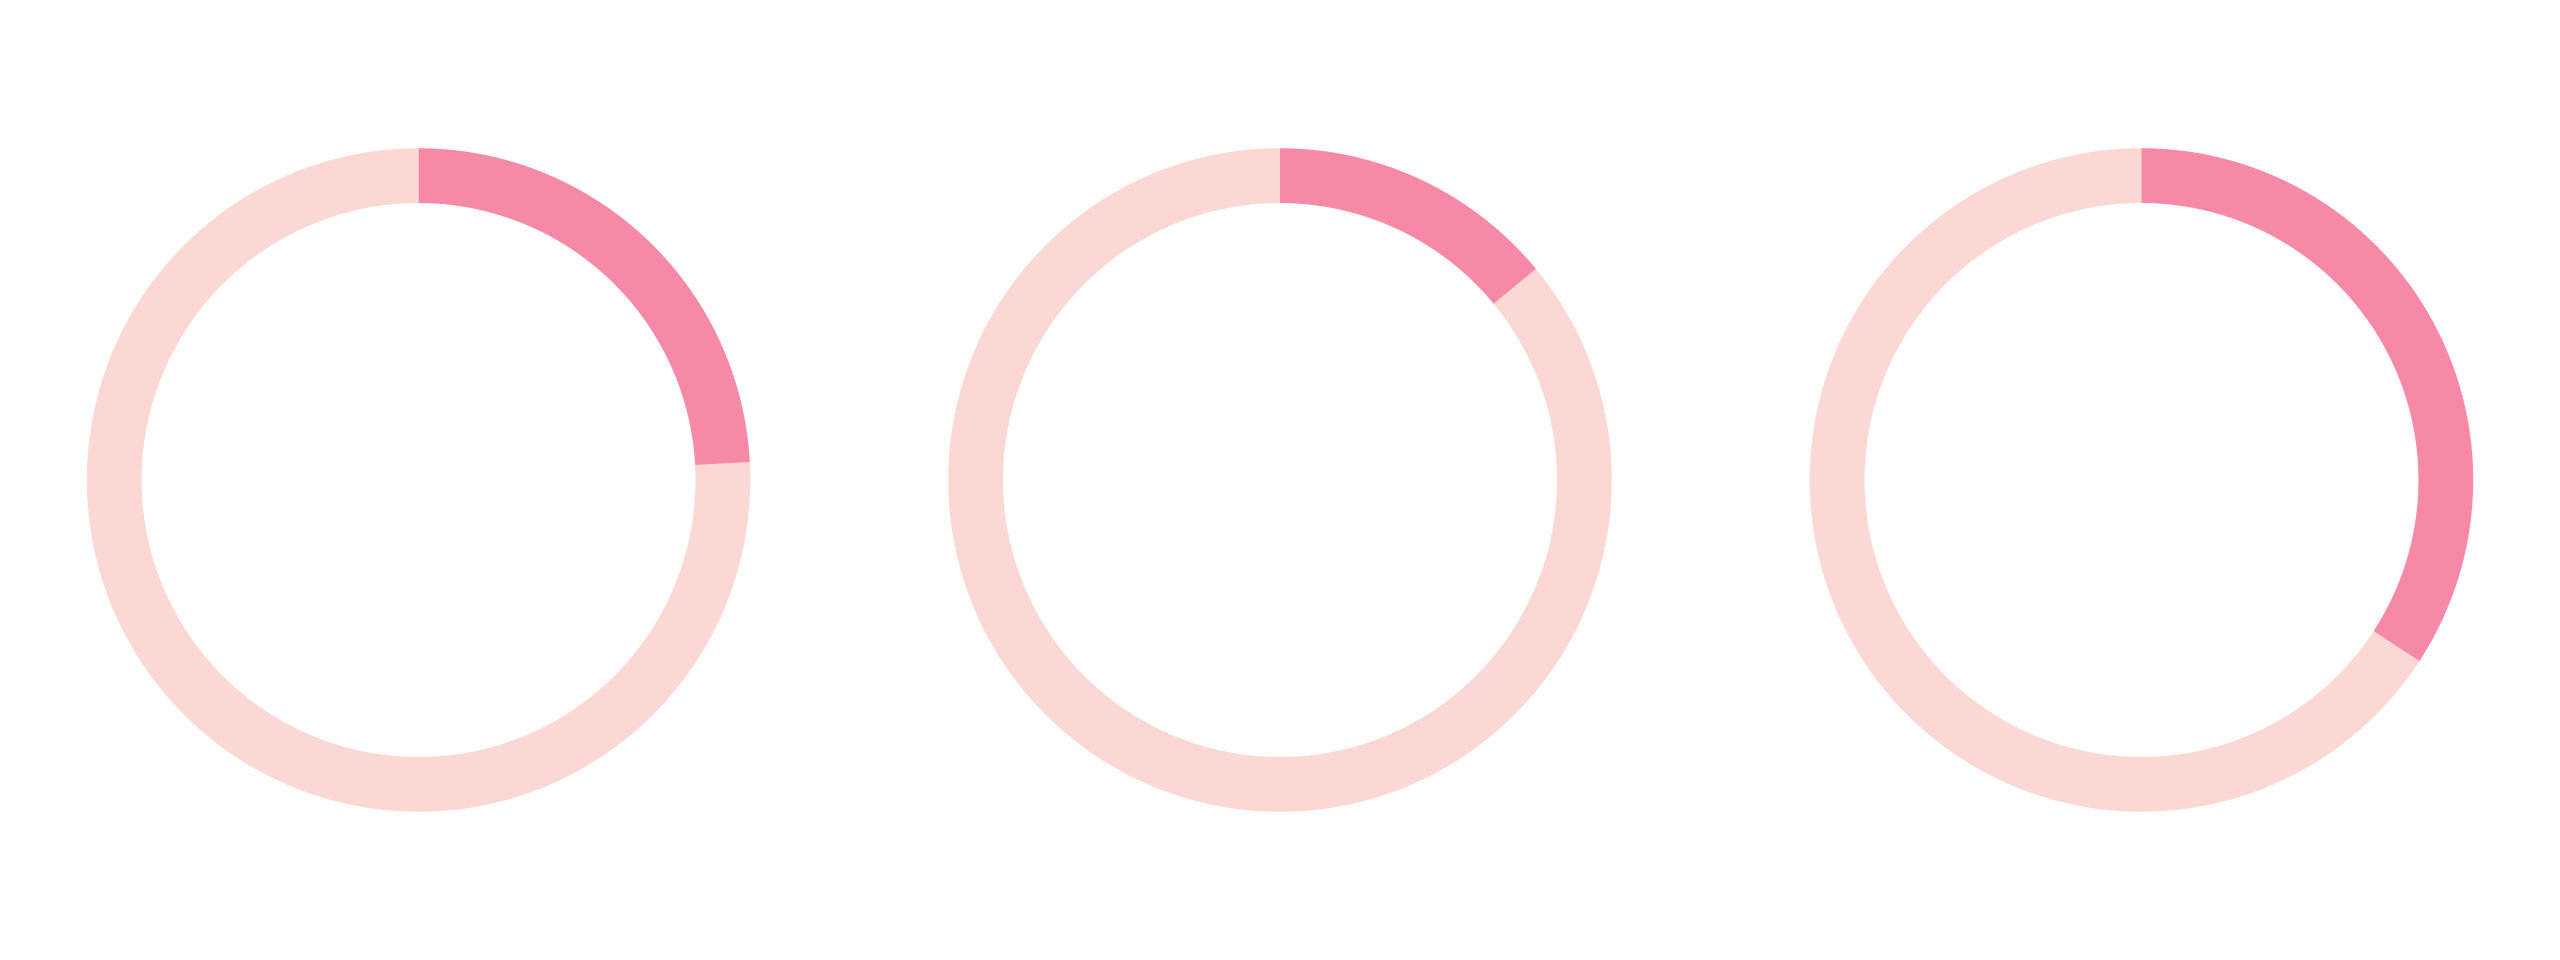
하나씩 그래프를 만들어보기로 한다. 우선, 도넛차트를 하나 만들어본다. 자세한 방법은 예전 포스팅을 참고한다.
(ggplot2) R 프로그래밍 파이차트/도넛차트 예제
오늘은 파이차트(원모양의 그래프, 원그래프) 혹은 가운데가 비어있는 도넛차트를 만들어보려 한다. 기본 데이터셋인 mtcars 를 활용해서 우선 bar 차트를 만들어야 한다. 여기서 중요한건, factor
emflant.tistory.com
ggplot(tb_car_accident6, aes(x = 1, y = death, fill = gender)) +
  geom_col(position = "fill") +
  facet_wrap(~ age_type2, ncol = 3) +
  scale_x_continuous(limits = c(-4,1.5)) +
  scale_fill_brewer(palette = in_palette) +
  coord_polar(theta = "y") +
  theme_void() +
  theme(legend.position = "none",
        strip.text = element_blank(),
        plot.background = element_rect(fill = v_background_color, color = v_background_color))
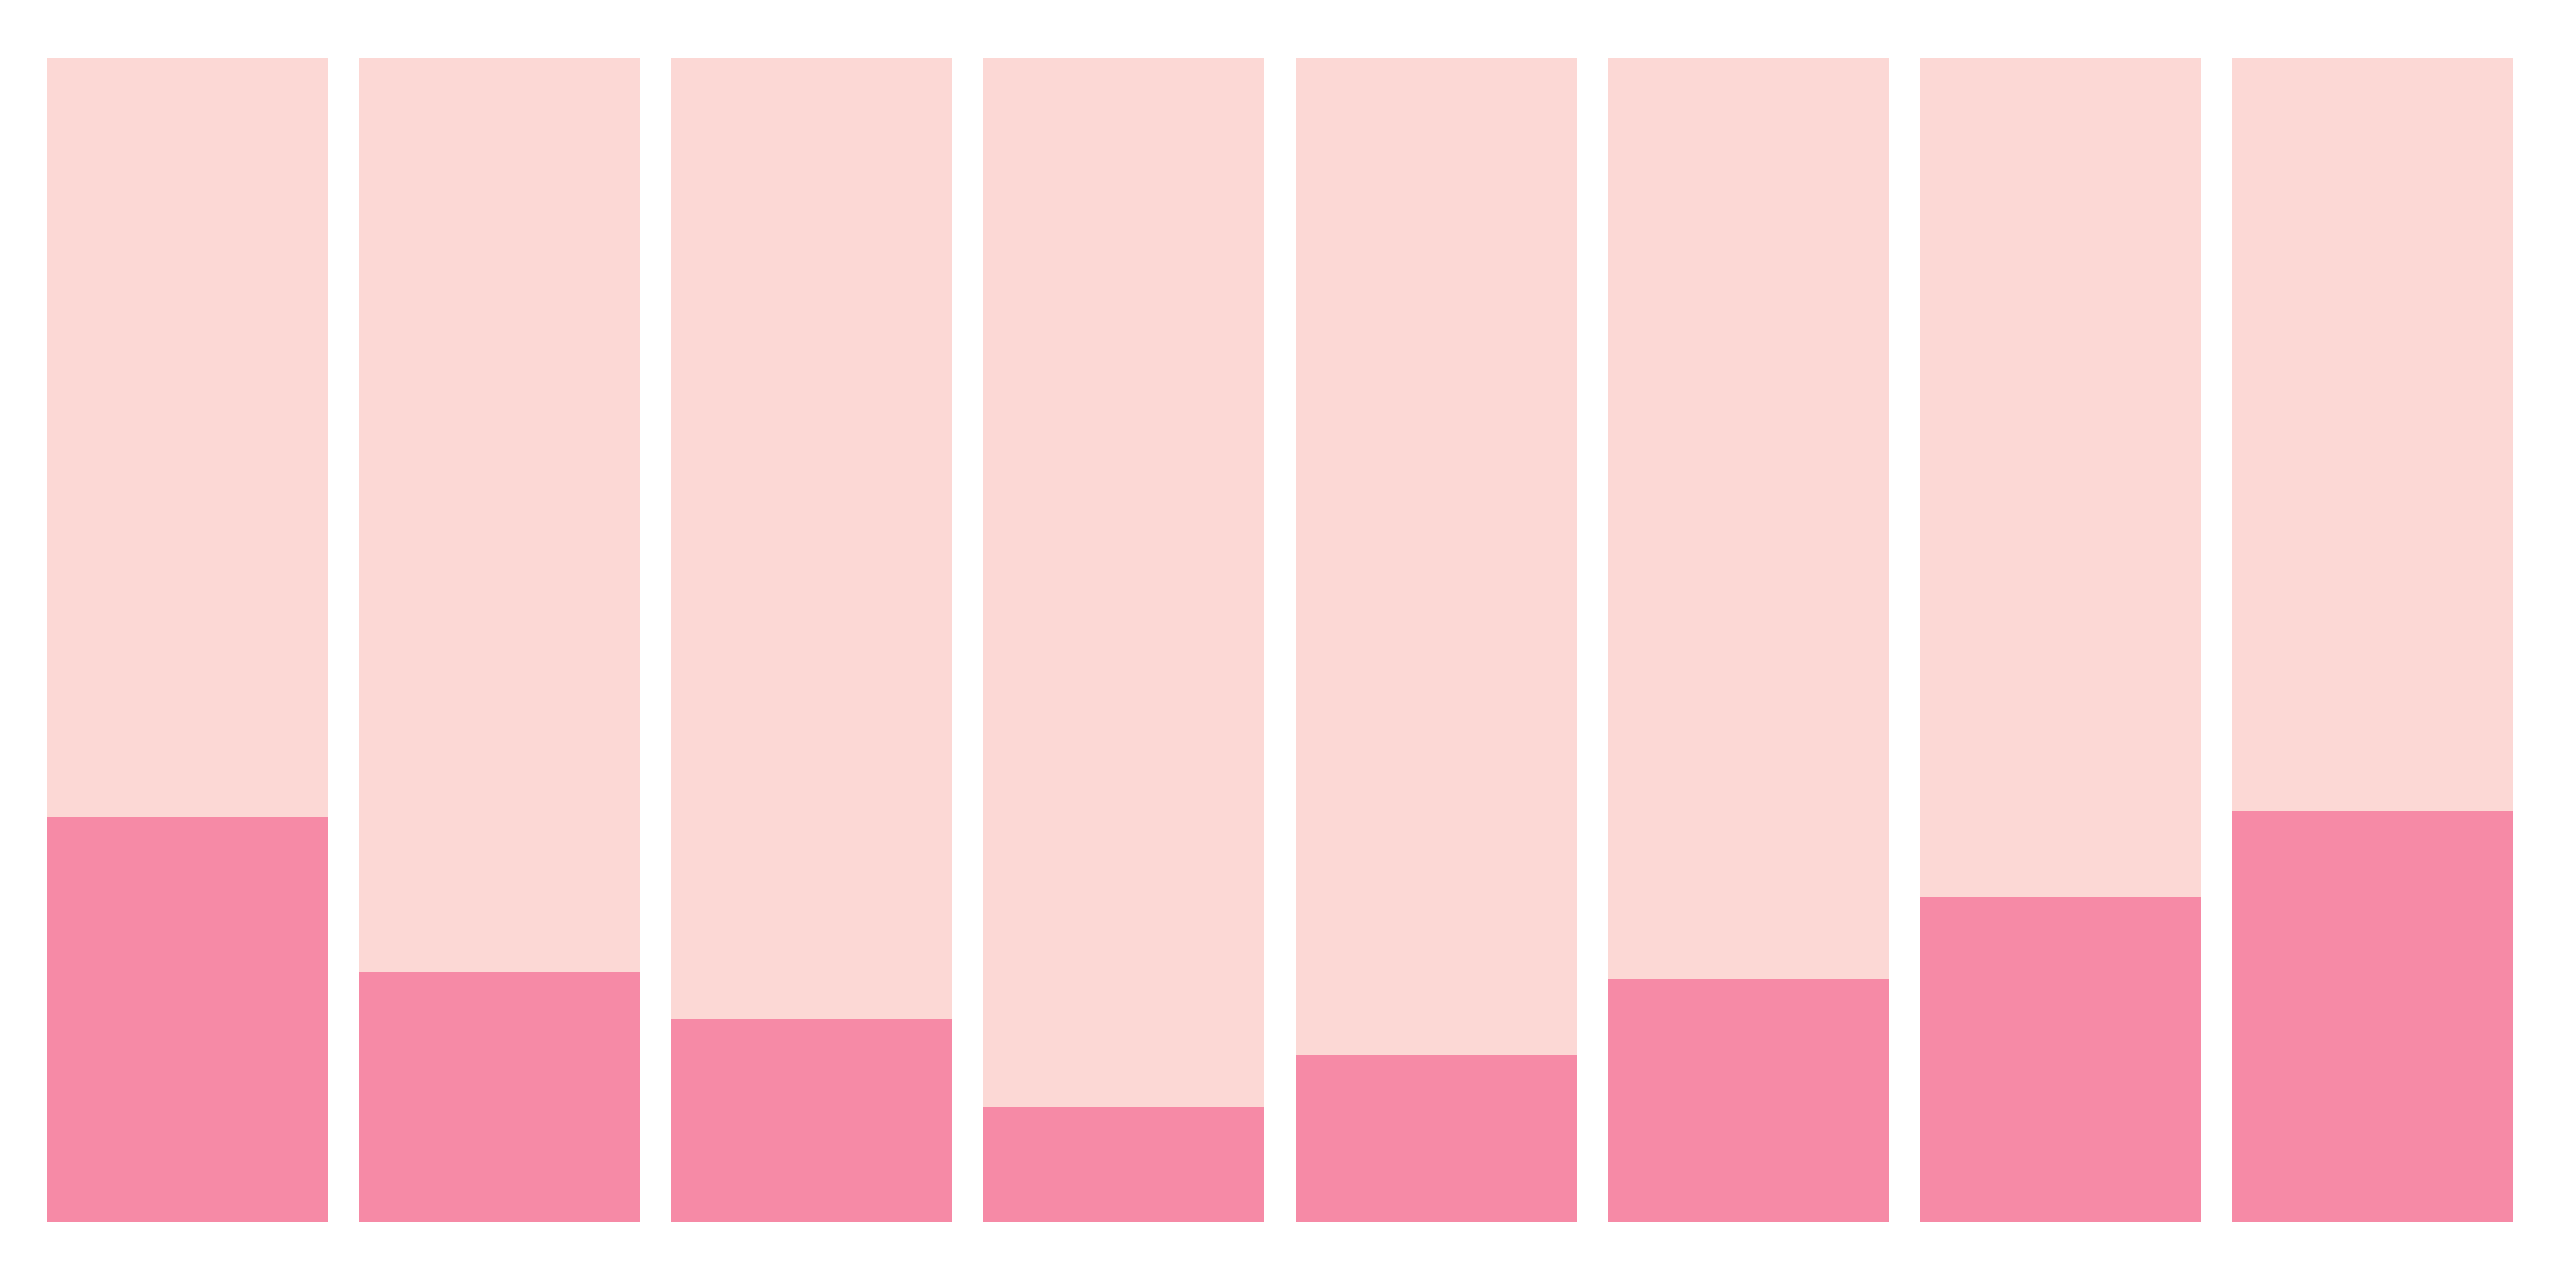
두번째로 막대그래프인데 비율을 알수 있는 분할막대그래프를 만들어본다.
ggplot2 분할막대그래프 예시
분할막대그래프는 실제 값으로 누적해서 막대그래프를 만드는게 아니라, 전체를 100% 로 보았을때, 각 파트별 비중을 한눈에 보기위한 그래프이다. 왼쪽그림은 그냥 값을 누적한 누적막대그래프
emflant.tistory.com
ggplot(tb_car_accident3, aes(x = age_type, y = death, fill = gender)) +
  geom_col(position = "fill") +
  scale_fill_brewer(palette = in_palette) +
  theme_void(base_family = "AppleSDGothicNeo-Bold", base_size = 15) +
  theme(legend.position = "none",
        plot.background = element_rect(fill = v_background_color, color = v_background_color))
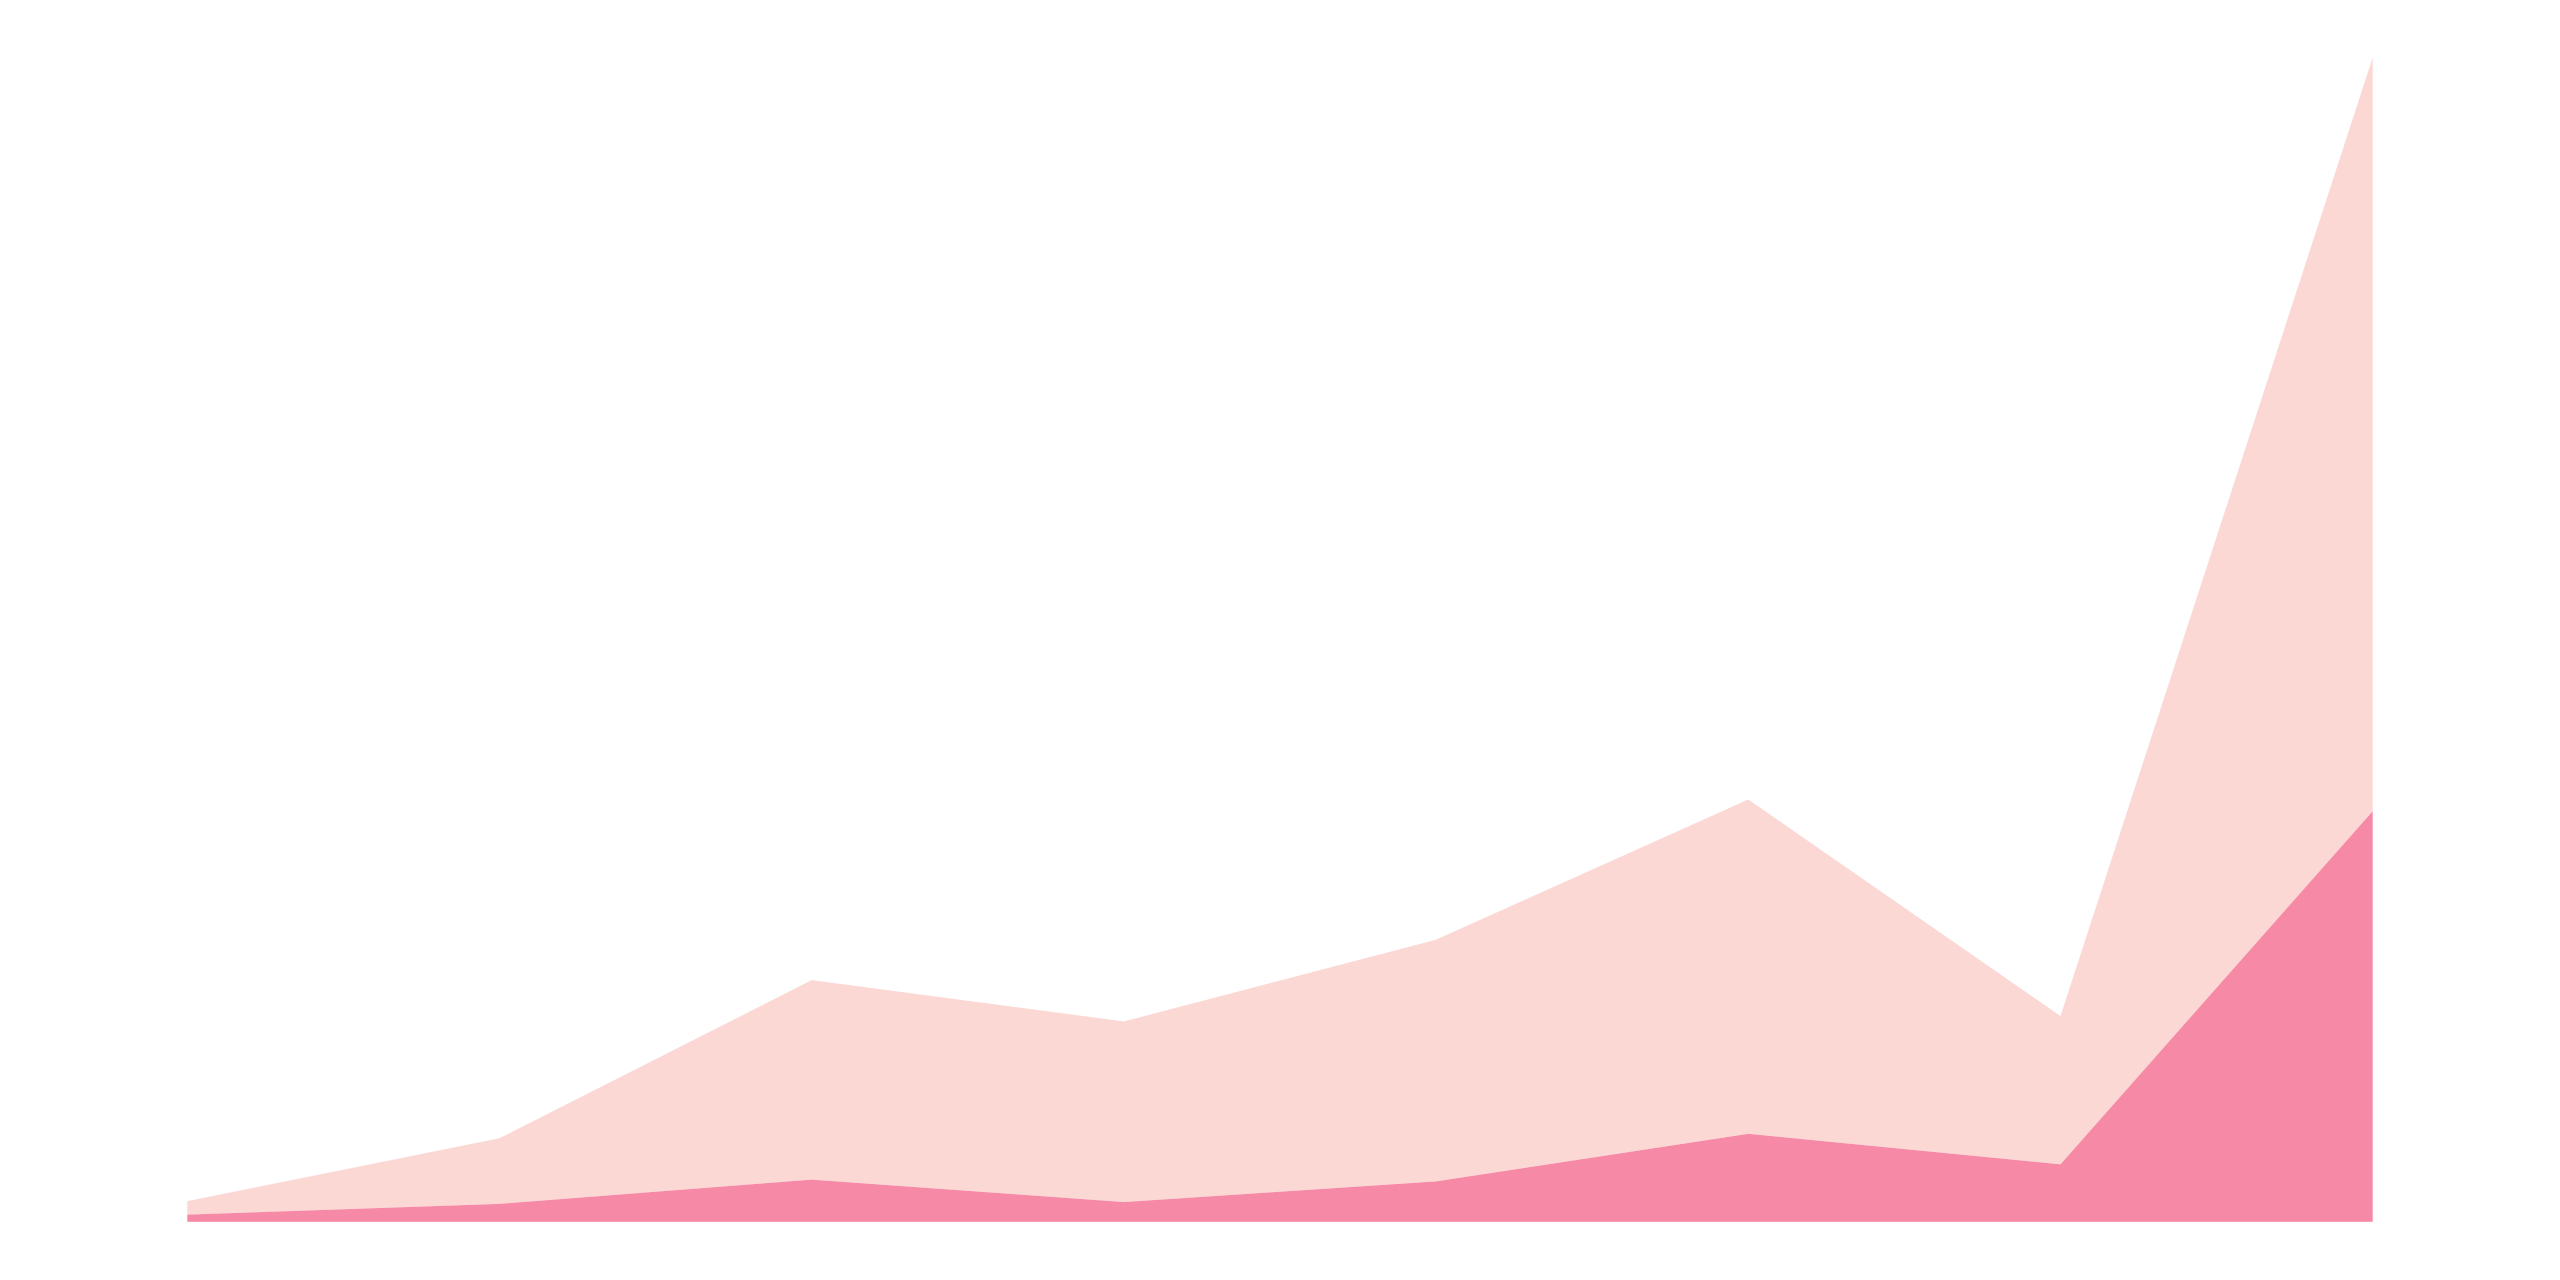
마지막으로 꺽은선그래프를 그려본다. 단순 꺽은선그래프는 아니고, 누적으로 영역별로 색을 채워넣었다.
ggplot(tb_car_accident3, aes(x = age_type, y = death, group = gender, fill = gender)) +
  geom_area() +
  scale_fill_brewer(palette = in_palette) +
  theme_void(base_family = "AppleSDGothicNeo-Bold", base_size = 15) +
  theme(legend.position = "none",
plot.background = element_rect(fill = v_background_color, color = v_background_color))자 위의 3개 그래프를 정리해서 엮기만 하면 된다. 나의 경우 layout 텍스트를 임의로 만들어서 레이아웃 구성을 했다. A가 첫번째, B가 두번째, C가 세번째 ggplot 을 의미하고 그 비율대로 영역을 차지하게 된다. 자세한 내용은 patchwork 사이트를 참고한다.
layout <- "
AAAAAA
AAAAAA
AAAAAA
BBBCCC
BBBCCC
"

g1 + g2 + g3 + plot_layout(design = layout)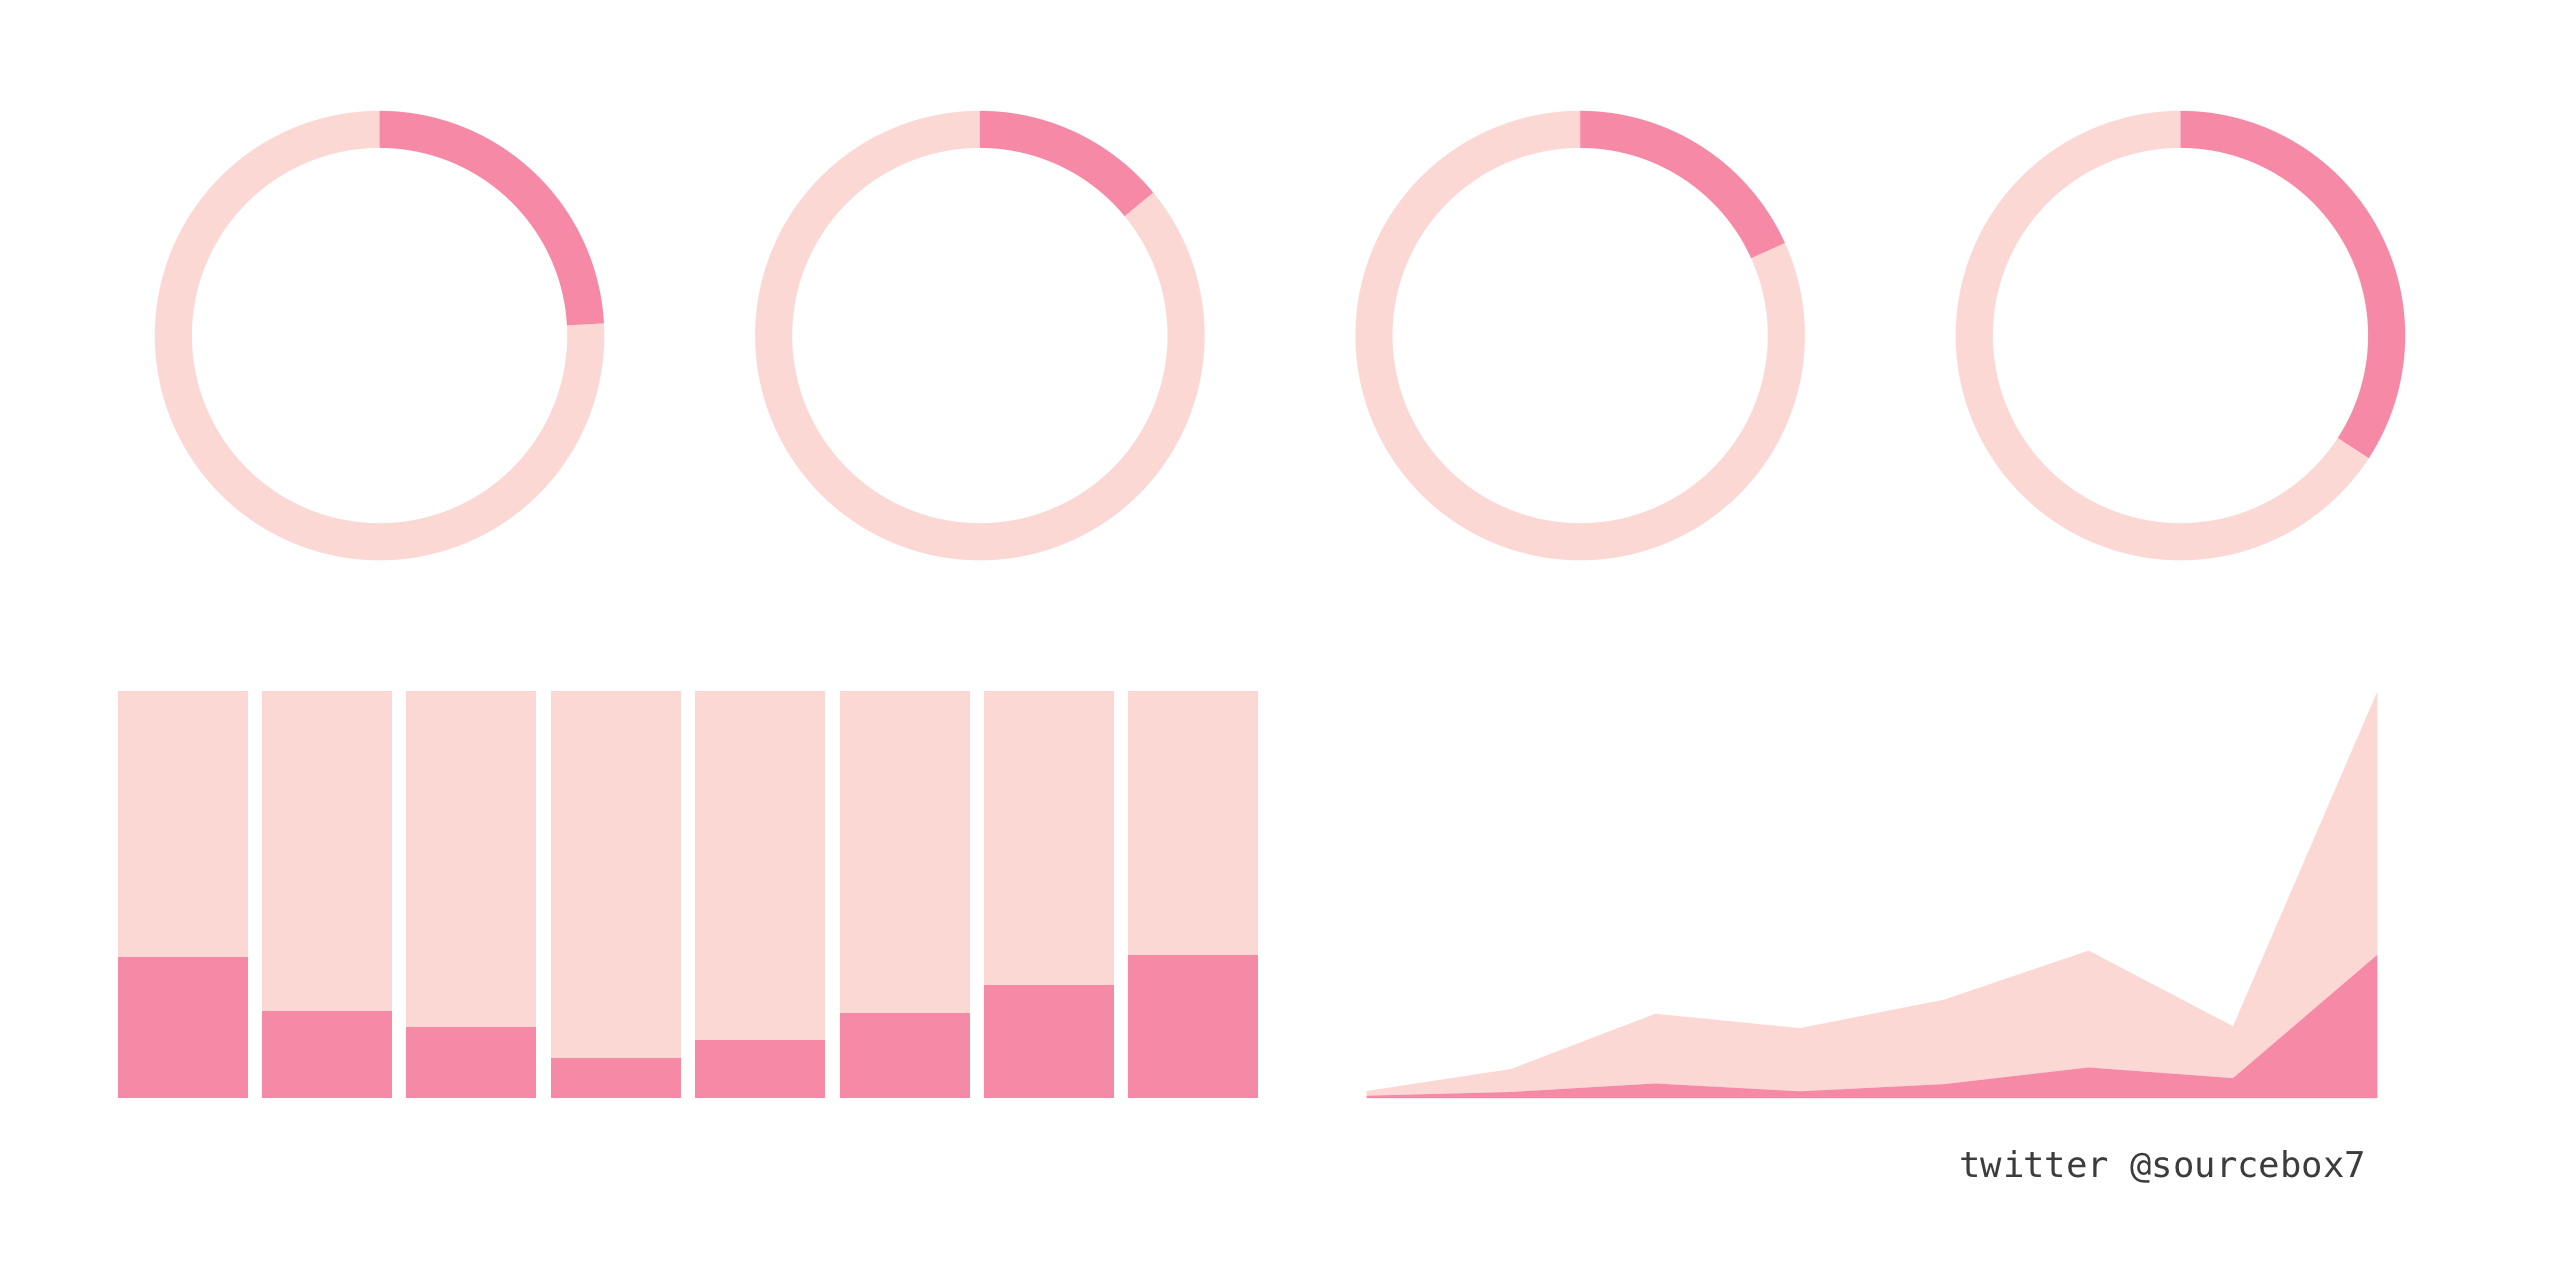
레이아웃을 조금 변경하면 아래와 같이 변한다.
layout <- "
BBBBBB
BBBBBB
AAACCC
AAACCC
"

g1 + g2 + g3 +
    plot_layout(design = layout)
마지막으로 한번 더 레이아웃 변경해본다.
layout <- "
AAACCC
AAACCC
AAACCC
BBBCCC
BBBCCC
"
g1 + g2 + g3 +
    plot_layout(design = layout)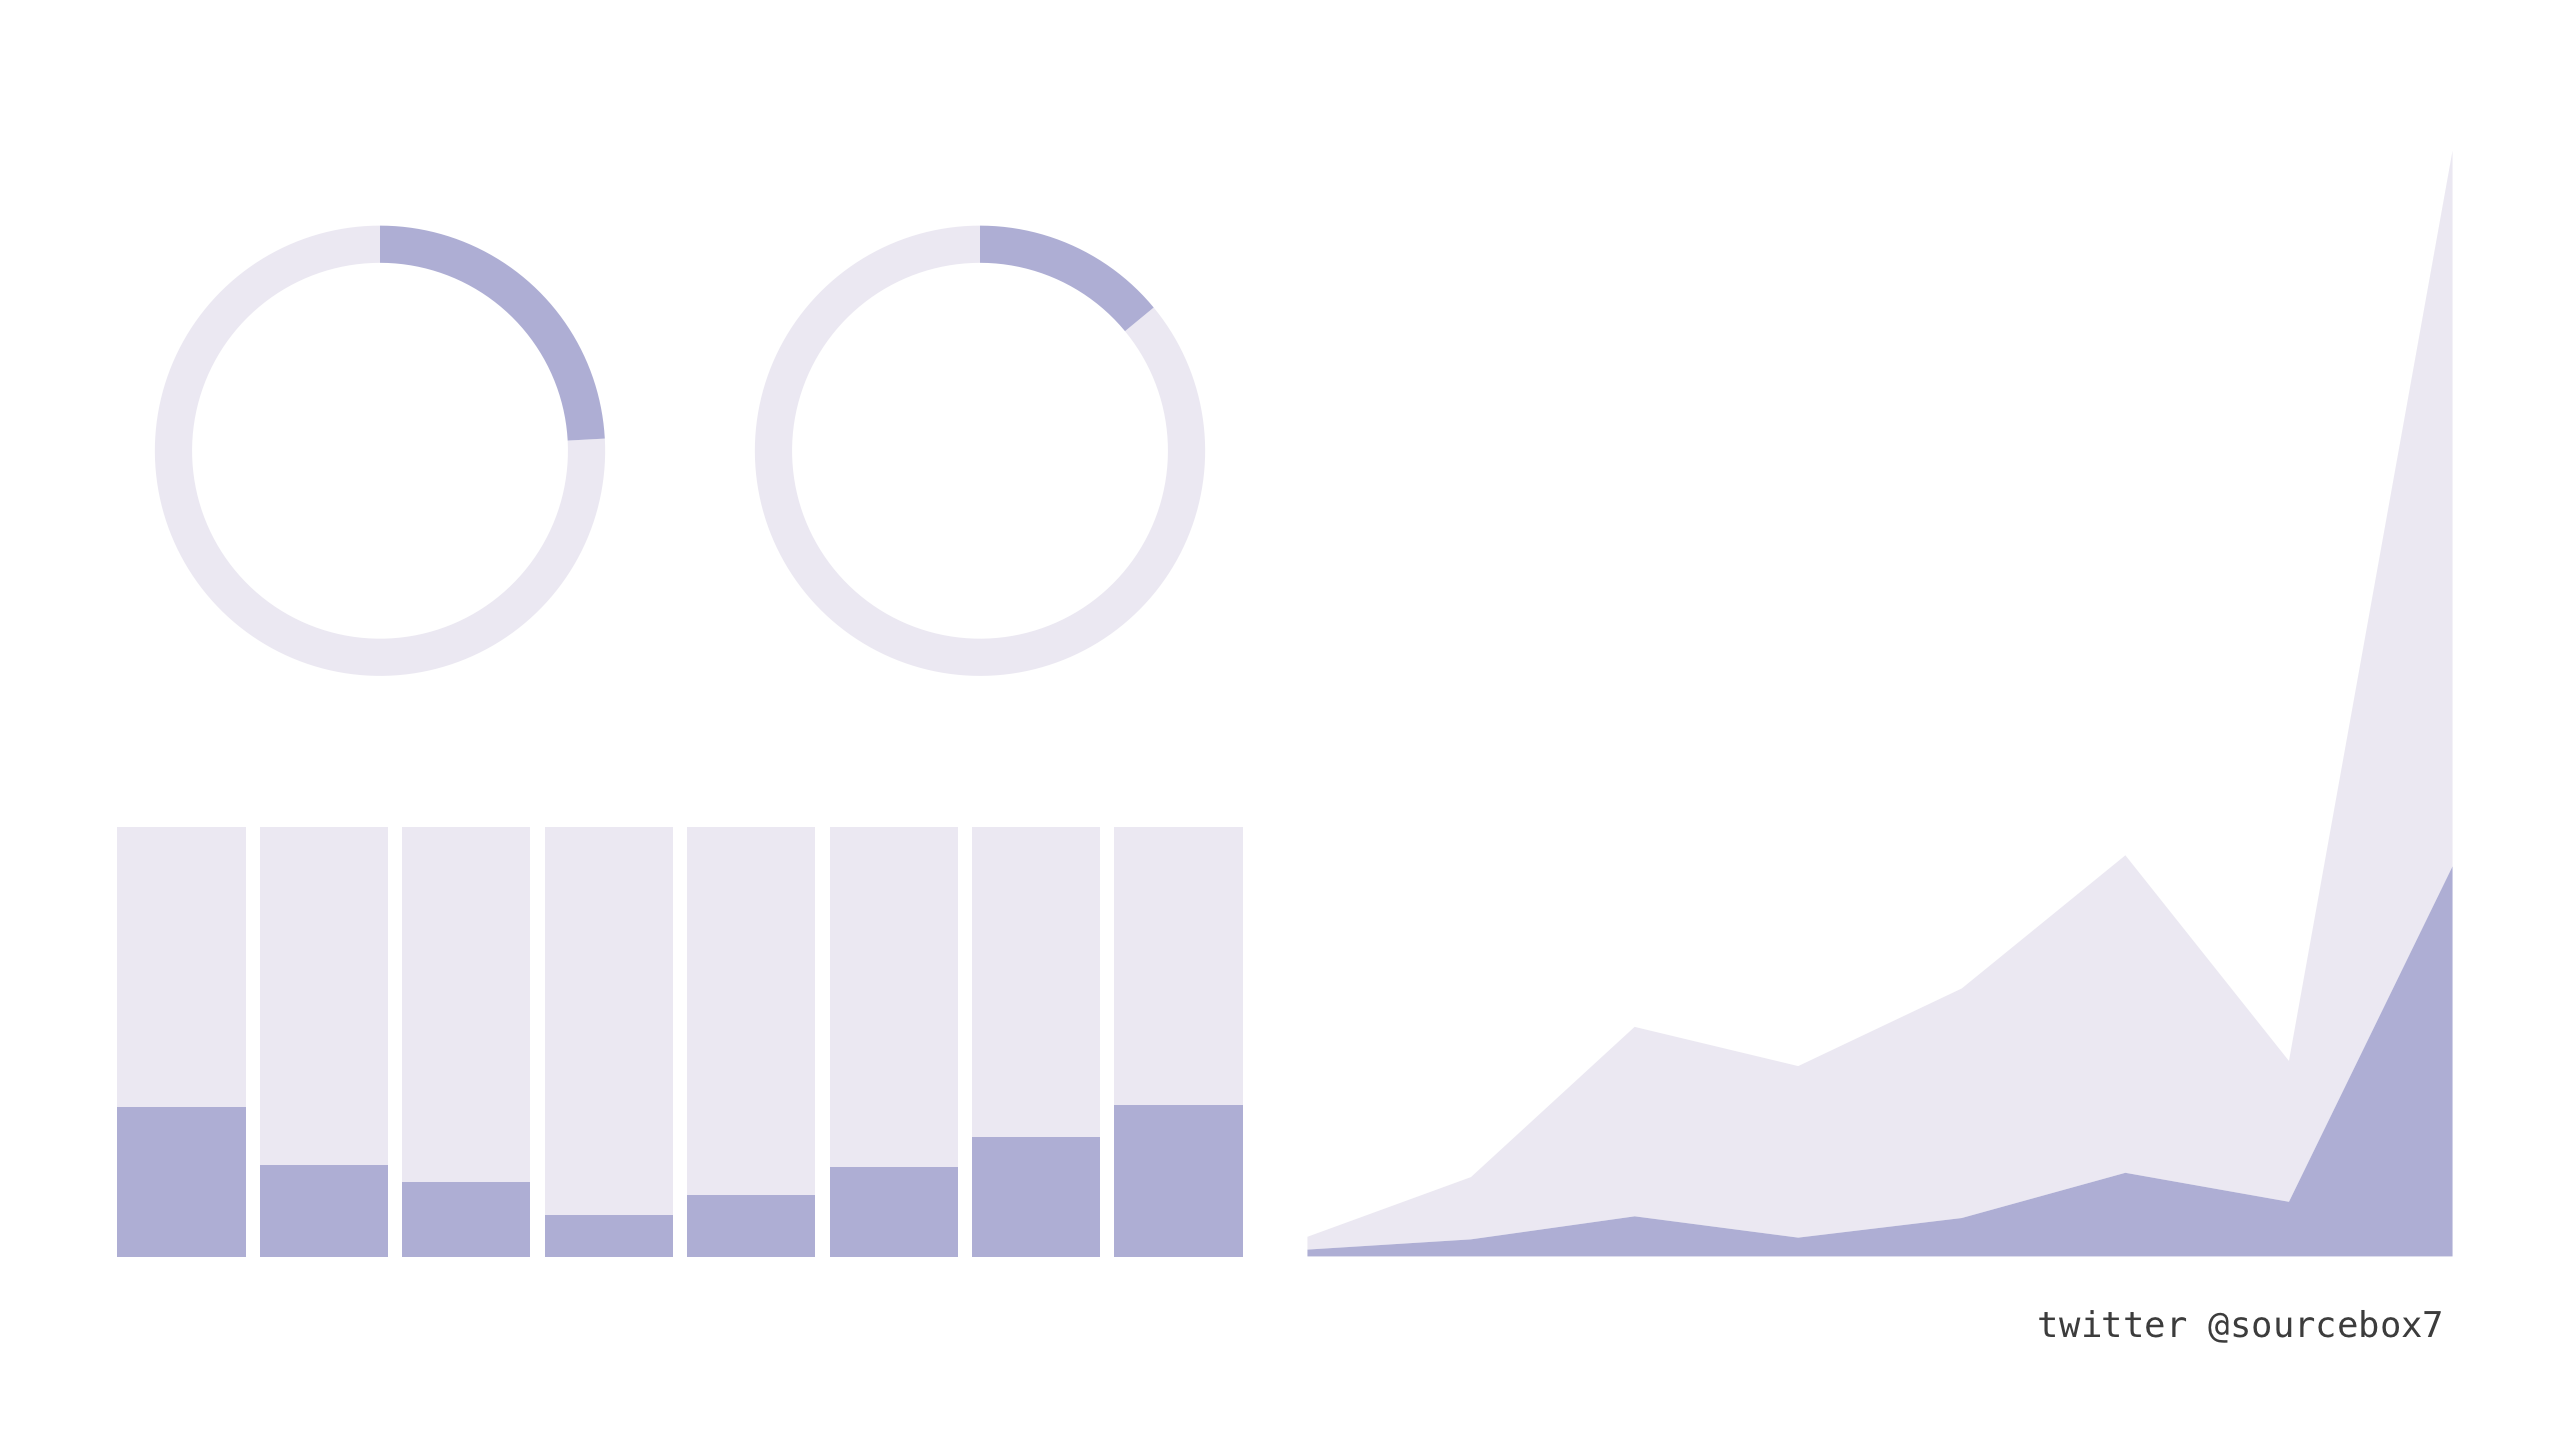
- Total
- Today
- Yesterday
- ktm모바일
- java
- 마인크래프트
- MongoDB
- vagrant
- 막대그래프
- R
- eclipse
- javascript
- Spring
- github
- 도넛차트
- 이클립스
- 아이맥
- MySQL
- MyBatis
- docker
- Google Chart Tools
- ggplot
- heroku
- ubuntu
- 알뜰요금제
- ipTIME
- 셀프개통
- SVN
- ggplot2
- Oracle
- 맥북
- python
- 자급제폰
| 일 | 월 | 화 | 수 | 목 | 금 | 토 |
|---|---|---|---|---|---|---|
| 1 | 2 | 3 | ||||
| 4 | 5 | 6 | 7 | 8 | 9 | 10 |
| 11 | 12 | 13 | 14 | 15 | 16 | 17 |
| 18 | 19 | 20 | 21 | 22 | 23 | 24 |
| 25 | 26 | 27 | 28 | 29 | 30 | 31 |
